Writing task 1 - grammar mọi người check giúp em với ạ!

watermelon_3101

Thành viên
Tham gia
12/11/2021
Bài viết
1
pasted-image-0-34.png

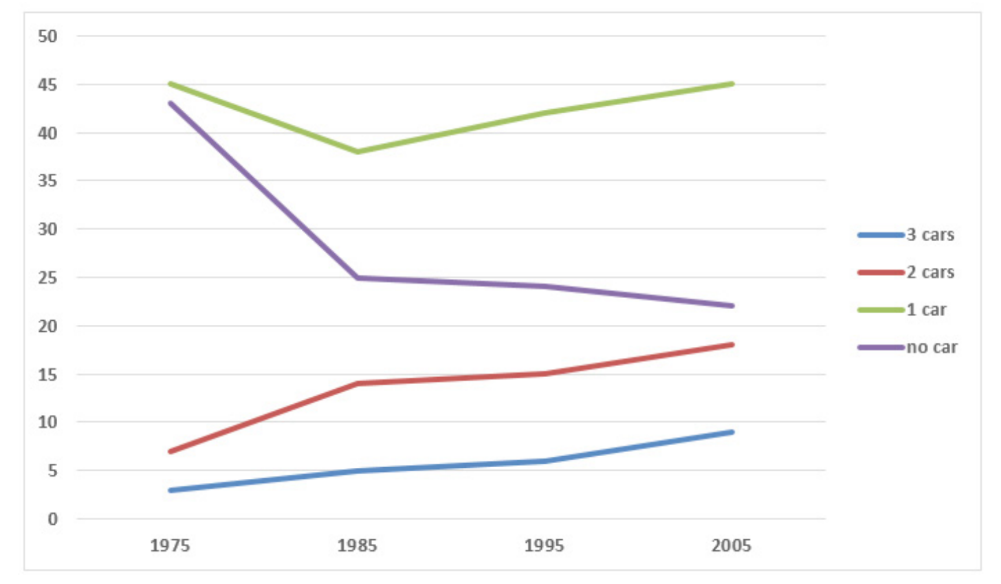
The line graph illustrates the change in car ownership in the UK between 1975 and 2005.
Overall, people who owned 1, 2 or 3 cars tended to rise gradually. On the other hand, the figure of those who owned no car decreased.
In 1975, the proportion of pp who owned one car was highest, approximately 45%, the following is people who owned 0 car accounted to 43%. Over the next ten years, these figures declined significantly, pp with one car and no car fell to about 38% and 25% respectively. By contrast, the percentage of those who owned 2, 3 cars increased slightly in 1985, to around 14% and 5%, respectively. Despise having small percentage around 7% and 3% respectively in 1975.
From 1985 to 2005, the percentage of pp who owned 2 and 3 cars continued to rise slightly around 18% and 9% respectively. Additionally, pp with one car after having decreased considerably about 38%, then it climbed to around 45%, accounted to approximately half of car ownership in the UK. Besides, a figure of pp with 0 car continued to drop to about 22%.
 
Mình sửa lại lỗi chính tả và diễn đạt nhé:

The line graph illustrates the evolution of car ownership in the UK from 1975 to 2005.

Overall, the proportion of households owning one, two, or three cars displayed a general upward trend over the period. Conversely, the percentage of households without a car experienced a gradual decline.

In 1975, single-car ownership was the most prevalent, accounting for approximately 45% of households. This was closely followed by households with no car, at around 43%. Over the subsequent decade, both these figures witnessed a notable decrease. The percentage of single-car owners fell to about 38%, while those with no car dropped significantly to roughly 25% by 1985. In contrast, the proportions of households owning two and three cars saw a modest increase during this period, reaching approximately 14% and 5% respectively in 1985, up from their initial small percentages of around 7% and 3% in 1975.

From 1985 to 2005, the upward trend in multi-car ownership continued, with the percentages of households owning two and three cars rising slightly to around 18% and 9% respectively by the end of the period. Interestingly, after the initial decline to about 38%, the proportion of single-car owners rebounded and climbed to approximately 45% by 2005, representing nearly half of all car ownership in the UK. Meanwhile, the percentage of households with no car continued its downward trajectory, reaching approximately 22% by 2005.
 
Quay lại
Top Bottom