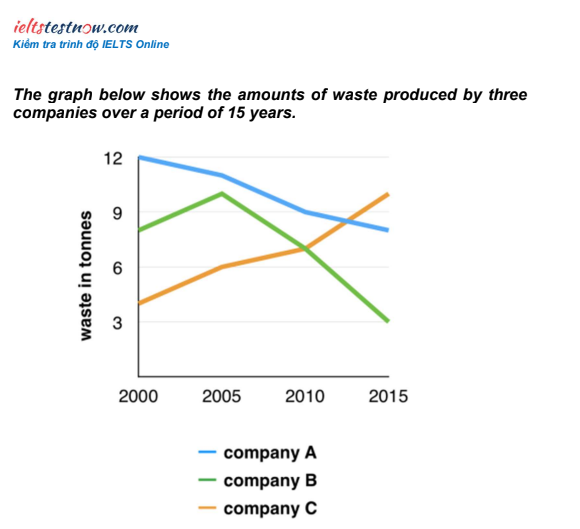
The line graph given provides a comparison of three companies in terms of their waste output during the period from 2000 to 2015.
From an overall perspective, it is evident that the amount of waste of company A and B showed a downward trend, whereas a reserve pattern could be observed in company C.
In the first year, waste produced by company A experienced the highest figure, at 12 tonnes, which is threefold waste of company C, at 4%, whereas company B accounted for approximately 8 tonnes waste. Over the following 5 years, there was an upward trend which can be witnessed in company B and C, growed up to 10 and 6 tonnes, respectively, while we can see the opposite in company A, reduced down to 11 tonnes.
In the period from 2005 to 2015, the amount of waste changed dramatically. There was a significant decrease in waste output of company B, from 10 to 3 tonnes. In company A, it reduced from 11 to 8 tonnes, which is more stable than company C. Whereas there was a reserve pattern in company C, the amount of waste increased from 6 to 10 tonnes.
