ĐỀ BÀI: The graph below shows the population figures of different types of turtles in India between 1980 and 2012.
Full paragraph:
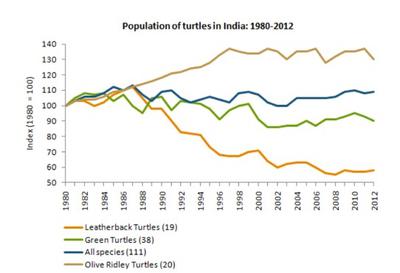
The given chart illustrates the fluctuations in the quantity of India turtles based on three groups from 1980 to 2012.
Overall, it is clear that the data for each type started at the same point. However, over the years, the total number of turtles fluctuated moderately, while that of Olive Ridley Turtles rose noticeably and of the remainders decreased.
In particular, India turtle population jumped back and forth erratically between around 95 and 110 units during the first 25 years before ending at just over 105 units in 2012, which was about 5 units higher than its original value. Regarding Olive Ridley Species, the provided time period recorded a remarkable escalation of more than 27 units in its number.
By comparison, the population of Green and Leatherback Turtles declined over the span and the difference between the two widened at the end of the phase. In the initial year 1980, there were 100 units of Leatherback and Green turtle community each; nevertheless, only 60 of Luth were left until 2012, making it the least populous turtle group. Likewise, Green turtle species’ data underwent some slight volatility and stayed at above 85 units in the last year.
 >>e có nhờ 1 vài người nhưng mà họ chỉ sửa lỗi ngữ pháp,
e thấy bài e bị mắc mắc ở chỗ nào ấy, cảm giác điểm nó cứ tầm 5-6 ấy
mọi người đọc và đánh giá điểm giúp e, nếu có thể thì mọi người đưa ra lời khuyên hay cách sửa hay hay với ạ ??
e xin cảm ơn mọi người>>
Full paragraph:
The given chart illustrates the fluctuations in the quantity of India turtles based on three groups from 1980 to 2012.
Overall, it is clear that the data for each type started at the same point. However, over the years, the total number of turtles fluctuated moderately, while that of Olive Ridley Turtles rose noticeably and of the remainders decreased.
In particular, India turtle population jumped back and forth erratically between around 95 and 110 units during the first 25 years before ending at just over 105 units in 2012, which was about 5 units higher than its original value. Regarding Olive Ridley Species, the provided time period recorded a remarkable escalation of more than 27 units in its number.
By comparison, the population of Green and Leatherback Turtles declined over the span and the difference between the two widened at the end of the phase. In the initial year 1980, there were 100 units of Leatherback and Green turtle community each; nevertheless, only 60 of Luth were left until 2012, making it the least populous turtle group. Likewise, Green turtle species’ data underwent some slight volatility and stayed at above 85 units in the last year.
>>e có nhờ 1 vài người nhưng mà họ chỉ sửa lỗi ngữ pháp,e thấy bài e bị mắc mắc ở chỗ nào ấy, cảm giác điểm nó cứ tầm 5-6 ấy
mọi người đọc và đánh giá điểm giúp e, nếu có thể thì mọi người đưa ra lời khuyên hay cách sửa hay hay với ạ ??
e xin cảm ơn mọi người
>>