alunaroseline123
Thành viên
- Tham gia
- 12/1/2022
- Bài viết
- 1
You should spend about 20 minutes on this task.
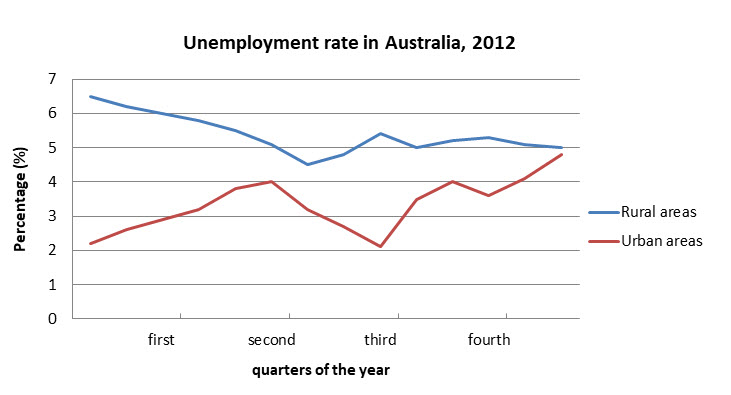
The chart shows the unemployment situation in Australia in the year 2012.
Summarise the information by selecting and reporting the main features, and make comparisons where relevant.
You should write at least 150 words.

Answer:
The chart demonstrates the proportion of the unemployed in the year 2012 of Australia.
The line graph indicates the unemployment rate in rural areas and urban areas in australia.There are 4 periods of the year 2012. We can easily see from the graph that the number of the unemployed in rural areas is larger than in urban areas, it changed periodically in a year and rach the peak in the first quarter of the year in rural areas.
The rate of the unemployed in both rural and urban areas is unstable anually. In rural areas, it rise the highest on the first period and continue to waxed and waned until the second period , it reach the plateau.
The proportion of unemployed people in the urban areas is incomparable to the on in the rural but its highest is on the fourth period and the lowest is on the first and third quarter of the year
The chart shows the unemployment situation in Australia in the year 2012.
Summarise the information by selecting and reporting the main features, and make comparisons where relevant.
You should write at least 150 words.

Answer:
The chart demonstrates the proportion of the unemployed in the year 2012 of Australia.
The line graph indicates the unemployment rate in rural areas and urban areas in australia.There are 4 periods of the year 2012. We can easily see from the graph that the number of the unemployed in rural areas is larger than in urban areas, it changed periodically in a year and rach the peak in the first quarter of the year in rural areas.
The rate of the unemployed in both rural and urban areas is unstable anually. In rural areas, it rise the highest on the first period and continue to waxed and waned until the second period , it reach the plateau.
The proportion of unemployed people in the urban areas is incomparable to the on in the rural but its highest is on the fourth period and the lowest is on the first and third quarter of the year