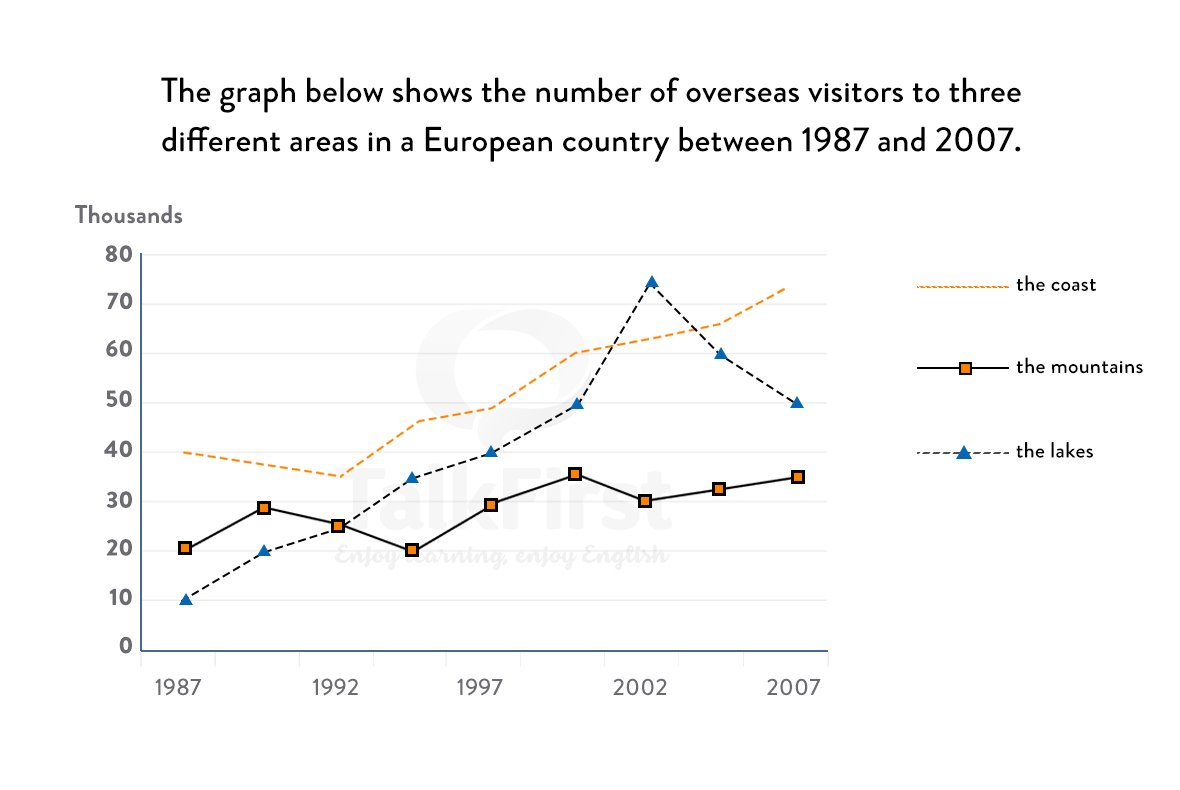
The line graph illustrates the quantity of foreign visitors to three distinct regions in a European country from 1987 to 2007.
As can be inferred from the line graph, three categories recorded an increase in the number of oversea visitors through a 20- year period. Also, the majority of aboard visitors preferred going to the coastal areas and the lakes region in most of the period, the opposite trend can be seen for the number of aboard visitors visiting the mountainous region.
Regarding coastal visiting, starting at 40 thousand people in 1987, the figure grew considerably to over 70 thousand people in the last year. The same pattern can be seen for the number of people traveling to the lakes which went up steadily from 20 to 35 thousand visitors within 20 years.
Only 10 thousand people traveled to the lakes which was the lowest figure among three different areas at the starting point. However, a surge of 65 thousand people was seen in 2002 before dropping significantly to 50 thousand people in 2007.