King Arthur
Thành viên
- Tham gia
- 12/1/2022
- Bài viết
- 1

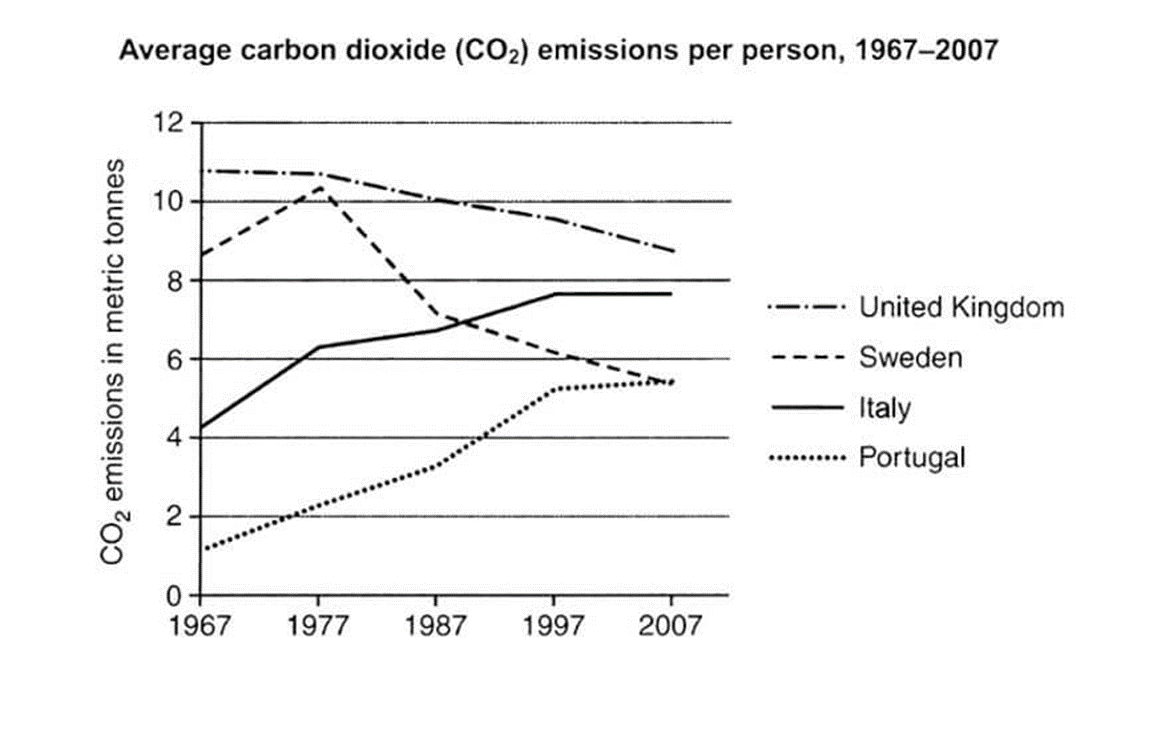
Overall, the emission of CO2 per person in the United Kingdom and Sweden decreased for most of the period, the opposite was true for Italy and Portugal. It is also notable that the UK had the highest figure over the period shown.
In 1967, the average of carbon dioxide in the UK was around 11 metric tonnes, while the figure for Sweden was only 8 metric tonnes. The average amount of CO2 released by the Swedish reached its highest point of over 10 metric tonnes in 1977 but dropped gradually for the rest of the period. Similarly, the figure for the UK declined slightly over the whole 40 years period and ended at under 9 metric tonnes in 2007.
The amount of CO2 emission per person in Italy and Portuguese started at around 4 and 1 metric tonnes in 1967 respectively. During the period shown, these figures rose steadily and ended at around 8 and 5 metric tonnes respectively.
